
by Douglas J. Morrice, Jonathan F. Bard, Harshit Mehta, Swarup Sahoo, Natesh B. Arunachalam and Prashanth Venkatraman (The University of Texas at Austin)
As presented at the 2018 Winter Simulation Conference
Abstract
Fragmentation is a common problem in the United States healthcare delivery system. For patients with complex medical conditions requiring multiple providers, this problem is particularly perplexing. One solution being developed, called an Integrated Practice Unit (IPU), involves a co-located multidisciplinary team of providers addressing a patient’s medical condition over a full care cycle. In this paper, we use simulation to design a WorkLife IPU that treats medical issues arising in the workplace from minor illnesses to acute non-urgent injuries. More specifically, we determine a patient appointment schedule and the number of resources required to achieve patient throughput, clinic closing time, and patient waiting time targets set by the IPU management.
Introduction
Historically, the United States healthcare delivery system has been fragmented. Thus, patients with medical conditions requiring multiple providers must coordinate and execute their own plan of care. The more complex the condition, the more challenging it is for patients, especially for those from underserved populations. Porter and Teisburg (2006) argue that the root cause for this fragmentation has been competition within the system at the wrong level. More specifically, they contend that competition is either too narrow (e.g., at the level of particular service) or too broad (e.g., at the level of healthcare plans), and should instead “take place for addressing medical conditions over the full cycle of care” (Porter and Teisburg 2006, page 44). The latter has the potential to create greater value for both patients and providers, and to result in more integrated approaches to healthcare delivery
To directly address this issue, Porter and Lee (2013) define the concept of an Integrated Practice Unit (IPU). An IPU is a co-located, multidisciplinary team of providers designed to treat the full care cycle for a specific medical condition. In an IPU, providers move around the patients, rather than patients having to move around to visit multiple providers in different locations. The “specific medical condition” considered in this paper is workplace-related issues ranging from minor illnesses and complaints to acute non-urgent injuries. Other applications being considered include cancer care at the MD Anderson Cancer Center in Houston, TX, a spine clinic at the Virginia Mason Medical Center in Seattle, WA, cardiac and vascular care at Cleveland Clinic in Cleveland, OH (Porter and Lee 2013), and a women’s health clinic and care for a variety of musculoskeletal conditions at the Dell Medical School (DMS) in Austin, TX (Koenig et al. 2016, Morrice et al. 2018)
In this paper, we use simulation to aid in the design of the WorkLife IPU in DMS at The University of Texas at Austin. More specifically, we determine a patient appointment schedule and the number of resources needed to achieve capacity, clinic closing time, and patient waiting time targets. From a scheduling perspective, an IPU may be viewed as an extended combination of a flexible flow shop and an open shop (Pinedo 2016) with multiple patient types on different care pathways through a multidisciplinary team of providers. With stochastic arrival and services times, along with stochastic routing, optimal formulations for determining patient and resource flow are intractable. Another complicating factor is that the IPU faces a mixture of scheduled and walk-in patients. Hence, we resort to simulation.
There are a number of simulation studies on healthcare delivery. Swisher et al. (2001) were one of the first to build a model using an object-oriented simulation package with graphical capabilities. They studied a family practice facility with the goal of maximizing a combination of clinic profit, and patient and staff satisfaction. Results were based on a fractional factorial design that included the number of mid-level practitioners, the number of nurses, the number of medical assistants, the number of check-in rooms, the number of examination rooms, and the number of specialty rooms. In work closely related to ours, White et al. (2011) developed an empirically based discrete-event simulation to examine the interactions between patient appointment policies and capacity allocation policies (i.e., the number of available examination rooms) and how they jointly affect resource utilization, patient waiting time and other performance measures. Data were gathered from an outpatient orthopaedic clinic with two different patient types, five registrars, two radiology technicians, and a single physician. One of the main distinctions our IPU work is the centrality of the patient with providers moving to patients rather than patients moving to different providers
The remainder of the paper is organized in the following manner. Section 2 contains he problem description. In Section 3, we describe the model. Section 4 provides results of our analysis and Section 5 contains concluding remarks.
Problem description
The WorkLife IPU in the Dell Medical School (WorkLife 2018) provides multiple services. It functions as a walk-in clinic treating minor medical conditions (e.g., sprains and strains, colds and flus) and provides common inoculations such as flu shots for workers at nearby businesses. The IPU also serves as an occupational health and injury clinic performing physicals and drug tests, and treating acute non-urgent workplace injuries. To support the occupational side of the business, Worklife provides administrative support to patients and their employers for workers compensation and workplace accidents, as two examples
With numerous services and a coordinated approach to care, the WorkLife IPU is staffed by multiple providers of different levels and sees five different types of patients, each with its own care pathway. The Base Case staff includes a Physician, two Nurse Practitioners (NPs), two medical assistants (MAs), two administrative personnel (referred to as Admins), and one Radiologist. The Physician is resident in the clinic about 40% of the time. Both the Physician and the Radiologist are shared resources with other IPUs in the Dell Medical School. Resources also include four exam rooms and two restrooms for drug screening.
Patients are categorized as Injury, Non-injury, Non-injury requiring MA only (MA Only, for short), Drug Screen only, and Follow-up. The Follow-up patient represents a follow-up appointment from a previous visit for a single incident. Figures 1-5 depict the care pathways for all patient types. Referring to Figure 1, after check-in, Injury patients may require a drug screen. Then they are placed in a room and undergo triage. Depending on the severity of the injury, the patient either sees a Physician or an NP. An Xray is conducted if required, and the patient returns to the provider for treatment. Once treatment is complete, the patient checks out of the clinic. Non-injury patients follow a very similar pathway except they only see the NP (Figure 2). MA Only patients (Figure 3) require minor care and as the name suggests, they only see the MA. Some patients on this pathway only require an injection (e.g., an immunization). The rest follow a pathway that is similar to Injury and Non-injury patients. As Figure 4 illustrates, Drug Screen patients follow a straightforward pathway. The drug screen is conducted by the MA. Follow-up patients follow a similar pathway to Injury and Non-Injury, except none require a drug screen since, if required, this would have been conducted on the initial visit. It is important to note that in an IPU, once a patient is assigned to a room, it remains her room until she goes to check-out. Except for the Radiologist who see patients in a specialized X-ray facility, all providers visit the patient in the room to which she is assigned.
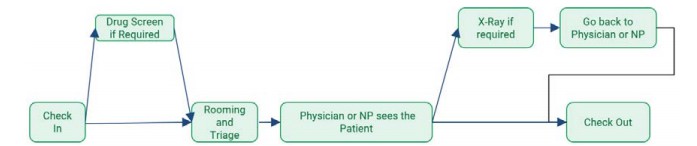
Figure 1: Care Pathway for Injury Type Patient.
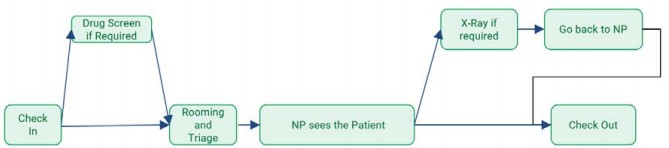
Figure 2: Care Pathway for Non-Injury Type Patient
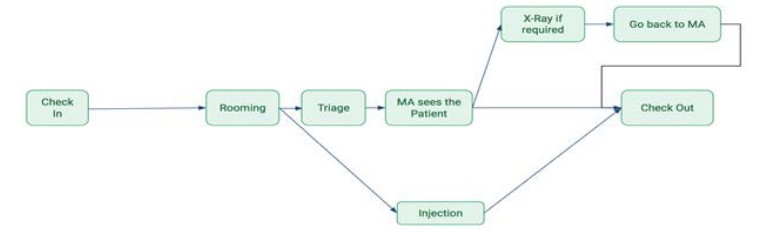
Figure 3: Care Pathway for MA Only Type Patient.
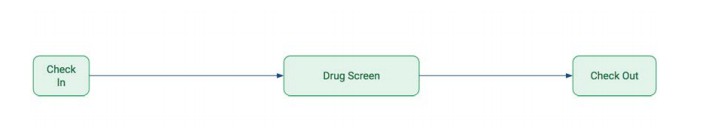
Figure 4: Care Pathway for Drug Screen Type Patient.
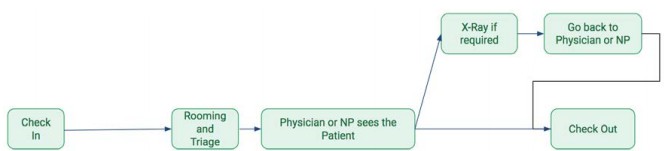
Figure 5: Care Pathway for Follow-up Type Patient.
For the WorkLife IPU, about 40% of the patients require an interpreter and those patients spend approximately 20% more time with each provider on average. While the need for an interpreter does not alter the care paths, from a modeling point of view, it does require the need to consider 10 patient types. The follow-up visits constitute about 35% of the patients on any given day. By definition, these are scheduled appointments. The remaining patient types are unscheduled walk-ins.
The WorkLife IPU management asked our research team to help them design a clinic with the following average requirements. First, they wanted to be able to see 55 patients per day. Second, clinic closing time needed to be close to 9 hours (or 5pm in the afternoon since the clinic is scheduled to open at 8am) in order to avoid overtime pay. Third, time waiting for check-in, rooming, and drug screen each needed to be less than five minutes to enhance patient experience. Finally, they wanted to be able to achieve these requirements with a minimal increase in Base Case staffing levels.
Model description
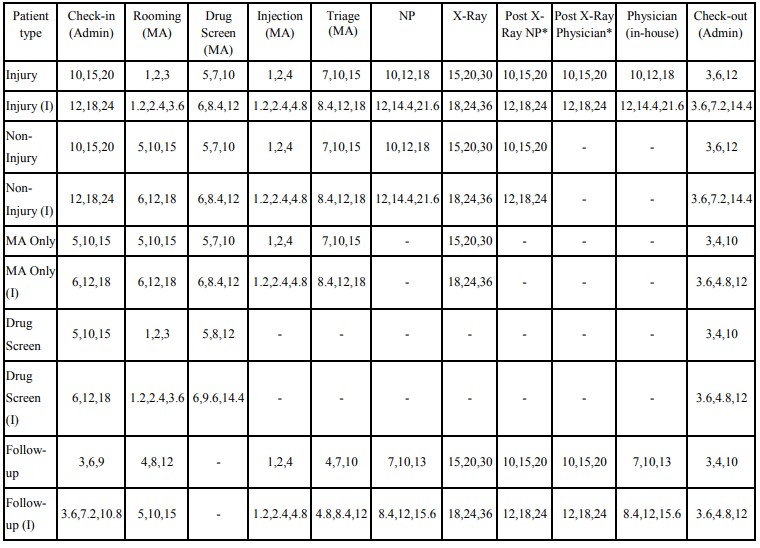
We modeled the WorkLife IPU using Simio (Simio 2018). The model is shown in Figure 6. Since this was a design project, the data for the simulation were collected from planned process flow diagrams and a series of meetings with the providers who would staff the clinic. We will refer to this group as our panel of experts. The discussions yielded data on the mix of patient types and the percentage of patients of each type needing each resource (Table 1). The latter determined the patient routing through the simulation. Note: the “(I)” designation in Table 1 (and subsequent tables) indicates a patient type that needs an interpreter. The deliberations also produced processing time distributions at each stage in the process for each patient type (Table 2). Note that in all cases, we used triangular distributions and solicited minimum, mode, and maximum parameter estimates from the expert panel. These parameters were determined for patients who do not require an interpreter. For those that did, the parameter values were increased by 20%. Our expert panel developed the 20% figure by consensus. Blank cells in Tables 1 and 2 indicate that the patient type does not visit the stage or resource.
It is important to note that no historical data existed on the WorkLife IPU for estimating service time distributions. Hence, we had to rely on expert opinion. Under such circumstances, triangular distributions have been found to be effective, because the parameters are understandable to domain experts and therefore easy to solicit (e.g., see Swisher et al. 2001). Additionally, with three parameters, the triangular distribution affords the flexibility to construct skewed or symmetric distributions with any desired range and mode. Finally, the panel of experts collectively had dozens of years of experience with the various activities in the process. Hence, we were able to solicit fairly good estimates for service time distribution parameters by building agreement amongst the experts.
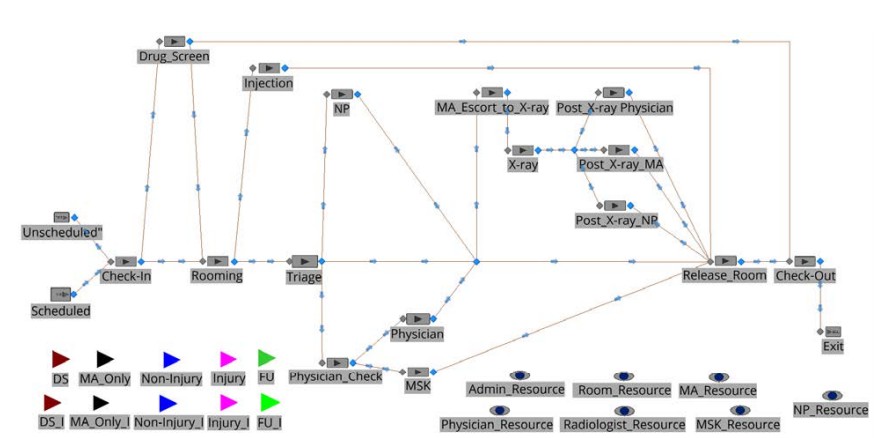
Figure 6: Simio Simulation Model of WorkLife IPU.
Table 1: Patient Probabilities for Walk-in and Follow-up Visits at WorkLife IPU
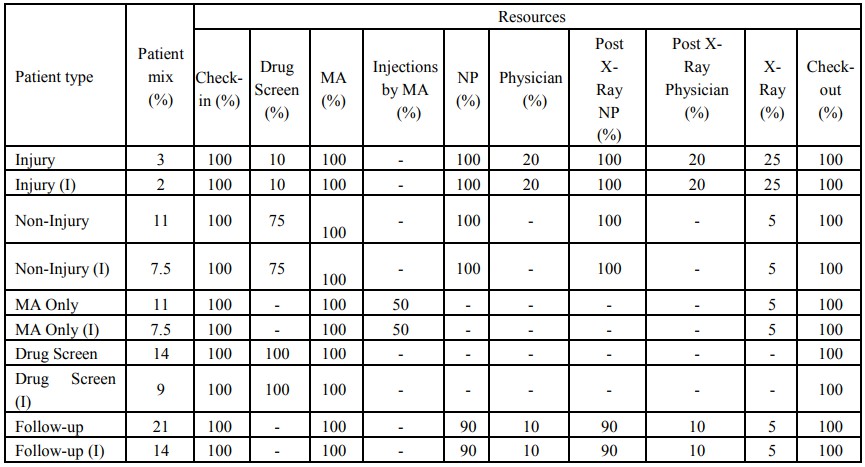
Table 2: Minimum, Mode, and Maximum Parameters for Triangular Probability Distribution Processing Times at Each Stage by Patient Type.
Returning to the simulation model in Figure 6, the ten different patient types are represented by the entities in the top left-hand corner of the figure. The walk-ins patients (i.e., all non-follow-up patients) are generated by the source node labeled “Unscheduled” and the follow-ups by the “Scheduled” source node. Since the goal is to see 55 patients per day on average, 36 are unscheduled patients and 19 scheduled patients. IPU management believes that the walk-ins arrive uniformly between 8am and 4pm. Hence, the “Unscheduled” source node generates 4.5 patients per hour according to a Poisson distribution. Again, since there was no historical demand data, we had to rely on expert opinion. The experts believed that there would be no rush hour periods for walk-ins based on their experience in other clinics with similar patient demographics. More details about the schedule for the remaining 19 follow-up patients will be given in Section 4
While the simulation model in Figure 6 mimics the care path logic described for Figures 1 – 5, it does contain a few complexities that require additional explanation. First, the Physician is only resident in the IPU about 40% of the time since he is only required for a very small percentage of a few types of patients (see Table 2). If a patient arrives needing the Physician when he is not present, she is sent to see a Physician in a neighboring Musculoskeletal (MSK) IPU. This logic is represented in the model by the stations “Physician_Check”, “Physician”, and “MSK.” If patients go to MSK, they are considered to have exited the current system and are no longer tracked since they are now associated with another IPU beyond the scope of this study. Patients seeing the WorkLife IPU Physician requiring an x-ray are escorted by the MA. This is represented by the station “MA_Escort_to_X-ray” with a Triangular(3,5,8) distribution processing time. Finally, the providers must complete documentation after each patient. This requires complex logic using Simio Processes to ensure this step is done before the provider sees another patient.
Results
Determining the Schedule for Follow-up Patients
The 19 follow-up patients are scheduled to arrive at the WorkLife IPU over the day at 20-minute intervals starting at 8am with no scheduled appointments between 11:20am and 1pm to facilitate a lunch break. Hence, the last scheduled patient slot starts at 3:40pm. The schedule is shown in Table 3, which was determined through experimentation. First, since walk-ins are uniformly distributed throughout the day, it made sense to spread the scheduled patients across the day rather than cluster them. Second, we experimented with different appointment slot interval lengths and found that slots less than 20 minutes resulted in significantly more congestion in the system, making it hard to achieve the targets for check-in, rooming, and drug screen waiting times. In other words, smaller time intervals effectively led to clustering of the fixed number of patients. Slots greater than 20 minutes resulted in significantly longer clinic closing times, making it difficult to achieve the clinic closing time target.
It is important to note that the scheduling approach we used is referred to as IBFI (individual block/fixed interval). In other IPU design work (Morrice et al. 2018), we considered IBFI and several other scheduling rules from the healthcare scheduling literature (Bard et al. 2016; Cayirili et al. 2006; Milhiser et al. 2012) and found that none was dominant. These included TwoBeg (two patients are scheduled at time zero and one patient every 15 minutes thereafter), MBFI (multiple block/fixed interval, where two patients are scheduled every 30 minutes), and DOME, where patients scheduled early and late in the day are spaced closer together than those scheduled in the middle of the day. Hence, we used IBFI due to its ease of understanding and implementation.
Scenario Analysis
We consider four scenarios in our analysis. Table 4 contains the resources used in each scenario. Tables 5 and 6 provide the results from the simulation analysis. Each scenario is simulated for 500 days of operation of the WorkLife IPU. We focus on the Base Case results first. Recall that Base Case (column 2 in Table 4) has one Physician, two NPs, two MAs, two Admins, one Radiologist, four rooms, and two restrooms. It is clear from Table 5 that the Base Case fails to achieve management’s objectives. In particular, the average clinic closing time is significantly greater than 9 hours (or 540 minutes) from the start of each simulated day, and check-in, rooming, and drug screen average waiting times are all significantly greater than five minutes, exceeding double or even triple this target.
Table 6 indicates the Admin and MA are by far the most constrained resources. This is not entirely surprising since from Tables 1 and 2, all patients must see the Admin at Check-in and Check-out and each of these stages can take a significant amount of time because of the paperwork involved in workplacerelated medical incidences. Additionally, the MA must see all patients and MAs perform several steps in the process. It was somewhat surprising to management and the research team that both resources had such high and similar utilizations since they serve very different functions in the IPU.
At the other end of the spectrum, the Physician and the Radiologist have very low utilizations. However, these numbers only reflect the utilizations in the WorkLife IPU and not their utilizations across all IPUs in which they work.

Table 3: Schedule For Follow-up Patients
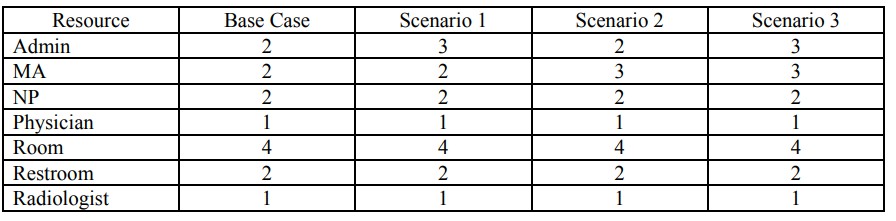
Table 4: Resources Used in the Four Scenarios.
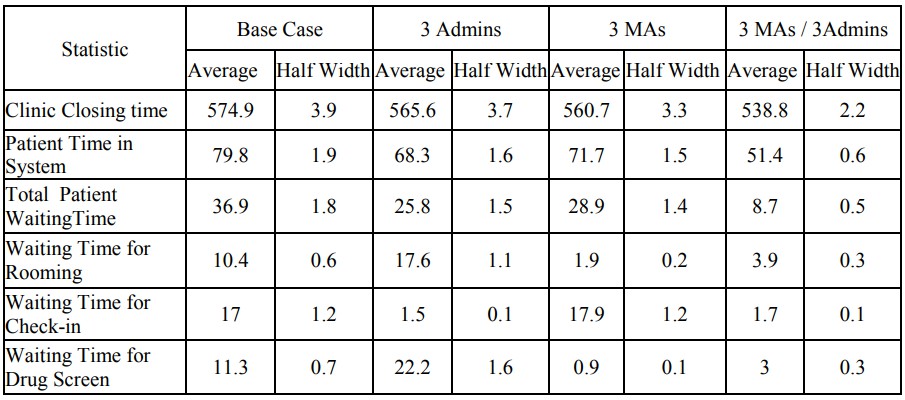
Table 5: Time-based Statistics for the Four Scenarios (All Times are in Minutes).
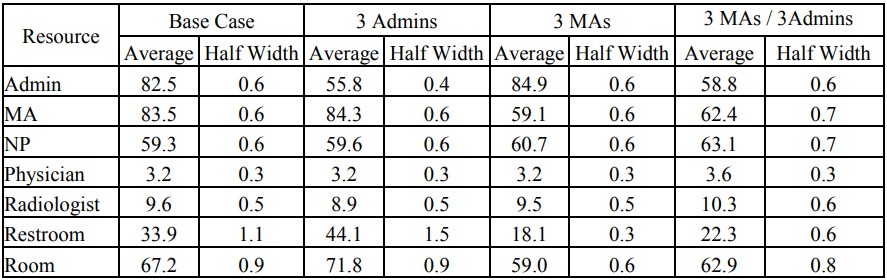
Table 6: Utilization Statistics for the Four Scenarios.
Since management wanted us to attempt to improve the system with the fewest resources possible, we considered the potential benefits of increasing only the number of Admins to 3, then only the number of MAs to 3 and finally the scenario where both are set to 3. Referring to Table 5, increasing the number of Admins to 3, significantly reduces the clinic closing time, but not enough to achieve the target of 540 minutes. It also significantly decreases the secondary performance measures of patient time in system and total patient waiting time. Waiting time for check-in decreases drastically and achieves the less than five minute goal, but at the expense of significantly increasing the waiting times for rooming and drug screen. So, while adding an additional Admin improves some important performance measures, it exacerbates existing bottlenecks associated with the MA.
Adding only one MA significantly improves clinic closing time (although not to be less than the target of 540 minutes), patient time in system, and total patient waiting time. It also reduces waiting times for rooming and drug screen tremendously. Unfortunately, but not surprisingly, it does nothing for waiting time for check-in.
It is only when both resources are added simultaneously that the system achieves all management targets. Furthermore, there are also dramatic reductions in the patient time in the system and total patient waiting time. Hence, the ideal strategy for the WorkLife IPU would be to hire an additional Admin and another MA. On the one hand, it is good news that the targets can be achieved by adding the least expensive resources. However, they cannot be achieved unless both resources are added together, which is a more expensive proposition.
In recognition of management’s desire for minimal increase in Base Case staffing levels, our results also show the benefits from adding only one or the other resource, perhaps sequentially over time as the budget allows. Based purely on the statistics, it appears that adding an MA first would bring the most benefit because the waiting time for rooming and drug screen decrease dramatically, the waiting time for check-in does not worsen over the Base Case, and the other three performance measures are statistically indistinguishable between the 3 Admins and 3 MAs scenarios. Nevertheless, adding an Admin first virtually eliminates the waiting time at check-in, but causes deleterious effects on the rooming and drug screen queues. Again, all the other statistics are a wash between the 3 Admins and 3 MAs scenarios. Of course, if eliminating queueing at check-in is a higher priority than at other stages in order to admit patients into the system more quickly (a non-statistical reason), then adding an Admin first might be an option that management might consider.
Lastly, Table 6 shows that by having 3 Admins and 3 MAs, the utilizations are largely balanced across the four main resources: Admins, MAs, NPs and rooms. Hence, there is likely little benefit from simply adding a fourth Admin and/or MA.
Conclusions
In this paper, we have used simulation for the design of a complex, multidisciplinary outpatient clinic serving many different types of patients called an Integrated Practice Unit. In a more general sense, the IPU may be viewed as an extended hybrid flexible flow shop and an open shop with complex job (or patient) scheduling requirements. The problem considered in this paper for a WorkLife IPU was particularly challenging because scheduled follow-up patients must be interspersed with walk-in patients. We found that since walk-in patients were uniformly distributed over the day, it was best to adopt a schedule that distributed scheduled patients over the day as well. This allowed us to focus achieving an appointment slot interval length that struck the right balance between system congestion and clinic closing time.
terval length that struck the right balance between system congestion and clinic closing time. Our scenario analysis showed that to achieve management’s targets for certain performance measures, the WorkLife IPU would have to add two additional resources at the same time: an additional Admin and another MA. This would have been difficult to ascertain without a simulation study since Admins and MAs perform multiple and different functions in the clinic. The WorkLife IPU management was very pleased with these insights, along with the schedule and throughput we showed the IPU could expect to achieve. Providers were of the opinion that they would have had to discover what we were able to show via simulation using trial and error in the real system, but the latter would have been much more costly and disruptive during the start-up of the new clinic.
Nevertheless, the current study has three main limitations. First, the lack of historical data means we had to rely heavily on expert opinion which could be biased. However, this is the nature of “green field” design. Ongoing work involves adapting the simulation model to support decision-making once the clinic becomes fully operational. In other words, the simulation model will be modified to support ongoing clinic operations rather than clinic design. With a fully operational clinic, we will be able to collect data, estimate distributions, and make adjustments based on these updated inputs.
Second, we only considered simulation of a relatively small finite set of scenarios. In future work, we will continue to work on improving IPU patient appointment scheduling using other simulation and optimization techniques. Lastly, with shared resources between the WorkLife and MSK IPUs, it would be better to simulate these two clinics simultaneously to understand their interactions. This is also part of our future research plans.
Acknowledgments
We would like to thank Mr. Pete Cardenas and the staff of the WorkLife Clinic at The University of Texas at Austin for their guidance and support on this project. Additional support was provided by a Simio Academic Software License Institution Grant.
Author biographies
DOUGLAS J. MORRICE is a professor of Supply Chain and Operations Management at The University of Texas at Austin. He holds the Bobbie and Coulter R. Sublett Centennial Professorship in Business and is a Senior Research Fellow in the University of Texas Supply Chain Management Center of Excellence. He has an ORIE Ph.D. from Cornell University. His research interests include simulation design, modeling, and analysis, healthcare delivery management, and supply chain risk management. Dr. Morrice was CoEditor of the Proceedings of the 1996 Winter Simulation Conference, and 2003 Winter Simulation Conference Program Chair. He served as a representative for the INFORMS Simulation Society on the Winter Simulation Conference Board of Directors from 2004-2012. His email address is douglas.morrice@mccombs.utexas.edu.
JONATHAN F. BARD is a professor of Operations Research & Industrial Engineering in the Mechanical Engineering Department at the University of Texas at Austin. He holds the Industrial Properties Corporation Endowed Faculty Fellowship and serves as the Associate Director of the Center for the Management of Operations and Logistics. He received a D.Sc. in Operations Research from The George Washington University, and has previously taught at the University of California - Berkeley and Northeastern University. His research interests are in the design and analysis of manufacturing systems, personnel scheduling, healthcare delivery, and algorithms for large-scale integer programs. He is a fellow of IIE and INFORMS, and a registered professional engineer in the State of Texas. His email address is jbard@utexas.edu.
HARSHIT MEHTA is a graduate student at University of Texas at Austin with major in Operation Research and Industrial Engineering. He has worked as Data Science Intern at Nexstar Digital. He has B.S in Mechanical Engineering from Delhi Technological University (India). His email address is harshit.mehta@utexas.edu.
SWARUP SAHOO is a Masters student in Operations Research and Industrial Engineering at The University of Texas at Austin. He is also a Research Intern at the MD Anderson Cancer Center in Revenue Cycle Analytics. He has a Bachelors Degree in Mechanical Engineering from the National Institute of Technology Rourkela, India. His research interests include analytics in healthcare & supply chain management, simulation, and machine learning. His email address is swarupsahoo@utexas.edu.
NATESH BABU ARUNACHALAM is a Graduate student at UT Austin majoring in ORIE. His research interests include econometrics, data analytics, and machine learning. He is pursuing research on statistical modeling of crude oil prices. His email address is natesh@utexas.edu.
PRASHANTH VENKATRAMAN is a graduate student of the Operations Research and Industrial Engineering program at The University of Texas at Austin. He is a Graduate Research Assistant with the Cockrell School of Engineering. He has a B.Tech in Production Engineering from the National Institute of Technology, Tiruchirappalli (India). His research interests include transportation network design, intelligent transportation systems, machine learning and optimization. His email address is prashv92@utexas.edu.