Skip to content
simio-background-png

Empty Container Stacking Operations: Case Study of an Empty Container Dept in Valparaiso Chile

CUSTOMER

Container Department, Chile

The Challenge

by Felipe Hidalgo, Diego Aranda, Jimena Pascual (Pontificia Universidad Católica de Valparaíso), Alice E. Smith (Auburn University), and Rosa G. González-Ramirez (Universidad de Los Andes Chile)

As presented at the 2017 Winter Simulation Conference

This paper describes a detailed stochastic simulation model integrated with a transactional database to model operations in an empty container depot. Empty container depots are found ubiquitously in supply chains around the world but there has been virtually no quantitative research done to assess operational policies nor layout designs. In this work we determine the performance of operational policies related to the stacking and retrieval of empty containers to derive recommendations for policy improvements and, in future work, the yard layout design. A simulation model was chosen as the proper tool to address these aims because of the uncertain nature and complex handling actions of an empty container depot. Results thus far show that policies concerning remarshalling and retrieval strongly influence the efficiency of the depot operations in terms of the truck turnaround times, as well as the utilization of the resources which include yard cranes and personnel.

Introduction

International trade has been a key factor in the development of world economies, increasing the need for efficient supply chains to distribute products and services in global markets (Rodrigue and Notteboom 2009). “Although the responsiveness of trade to the Gross Domestic Product (GDP) growth has been moderate over the recent years, demand for maritime transport services and seaborne trade volumes continue to be shaped by global economic growth and the need to carry merchandise trade” (UNCTAD 2015). In this regard, inland transport of cargo and empty containers plays a key role in the efficiency of global supply chains, particularly at strategic facilities such as port terminals, intermodal rail stations, warehouses or custom storage areas.

In this work, we present an analysis of the current handling operations at an empty container depot (ECD) that provides services for different shipping lines that operate with the port of Valparaíso. The depot is located in the inter-port area of Placilla (in the Valparaíso suburbs), where several depots and custom storage areas are located to provide cargo handling and other related services. The port of Valparaiso is the second largest port in Chile in terms of containerized cargo per year (measured in Twenty feet Equivalent Units, TEUs), and is ranked 18th in the Latin America and Caribbean region, according to the TEU turnover regional ranking published by the Economic Commission of Latin American and the Caribbean, United Nations (ECLAC-UN 2017).

The aim of the analysis presented in this paper is to determine the current performance of operational policies related to the stacking of empty containers at the yard and to derive recommendations for improved stacking policies. In later work, this information will be used to consider the issue of yard layout re-design. It is important to mention that stacking operations at this empty container depot are strongly influenced by the marketing strategy of the depot and the contracts in place with shipping lines. These contracts include a non-fee storage period, which motivates using a FIFO (First In, First Out) policy for the dispatching of empty containers. If an empty container overstays the non-fee storage period, another cost is incurred by the shipping company. This characteristic differs with respect to the operations at yards of a Port Container Terminal. For this reason, our work presents a novel contribution to the literature of container handling studies by analyzing a different application of stacking policies than those found in a port container terminal. Common practices with port container terminals are to the similarity of the handling equipment and the fact that containers are stacked at the ground. The retrieval policies are the ones that differ, and this is considered in the design of the simulation model and the computational experiments. The actual technical simulation approach is quite similar to others in the literature.

Literature Review

Several authors have studied logistics problems related to handling operations at multimodal container terminals, mainly focusing at seaport operations (Steenken et al. 2004; Stahlbock and Voβ 2008; Bierwirth and Meisel 2010; Bierwirth and Meisel 2015). Notably, Carlo et al. (2014) provide an overview and research directions for port storage yard operations. They distinguish between the following main decision problems that arise in the storage yard operations: (1) yard design, (2) storage space assignment for containers, (3) dispatching and routing of material handling equipment to serve container storage and retrieval processes, and (4) optimizing the remarshalling of containers. Of the nine research avenues identified by Carlo et al. (2014), our work contributes to RA3 in which the authors point out the integration of inland ports as extended storage yards in container terminals. This is related because we are considering a facility typically located in the port drayage (local transport) zone, or perhaps in the hinterland. And, these empty container depots serve as a node of the port supply chain.

At the tactical and operational levels, container stacking policies and the storage space allocation problem (including the pre-marshalling problem and the blocks-relocation problem) have been extensively addressed in the literature (Kim and Kim 1999; Kang et al. 2006; Lee and Hsu 2007; Park et al. 2011; Chen and Lu 2012). At the strategic level, yard design problems have been also addressed in the literature but not as extensively as container stacking strategies and policies. Yard design is an influential factor in the productivity of container handling operations (Kim et al. 2008), thus requiring strategic decisions in yard layout and in the number and placement of aisles (surrounding the container blocks). Several authors have focused on the analysis of layout design and strategic decisions related to equipment acquisition at port terminals (Wiese et al. 2011; Lee and Kim 2013; Kemme 2012; Taner et al. 2014).

Empty Containers Handling Operations: Analysis of Current Situation

The Placilla depot was chosen because it is typical of such depots and they provided full information access. The depot is divided into two main areas: reefer and dry containers. In this paper, we will consider only the operations of the dry-container area. However, our approach and much of our analysis, is applicable to reefer-container operations as well. Figure 1 presents a schematic of the dry container area of the ECD, as well as the gate access where external trucks enter and exit the ECD for container pick-ups (gate-out processes) or delivery (gate-in process). This facility stores roughly 2,000 containers at any given time.

As indicated in Figure 1, there is an inspection zone located at the main street where all arriving containers are inspected. For the inspection process, containers are segregated by size (40’ or 20’) and classified into operational or damaged. Operational is further classified into three different conditions ranging from near perfect to acceptable to marginally usable. There is a maintenance area where containers are repaired and where containers are cleaned. The wide streets allow for reachstacker cranes (or toplifter cranes) to operate and handle either type of container (20´or 40´), except for Street 1 . Street 1 is one way and used by the gate-in trucks to access the dry container inspection zone. The back street is used as the access lane for gate-out trucks retrieving a container from a particular block and as an exit lane for all trucks. Different sections are organized into container blocks, each assigned to a particular customer according to size and class, however often two classes of container are stored in the same block (blocks are split in half and containers of the two different classes are accessed from opposite extremes of the block). Each block has a capacity of eight containers deep (row) and up to seven containers high (tier). There is a total of 74 blocks of which 38 are 40 feet long and 36 are 20 feet long. A BAROTI notation gives the bay, row and tier specification for each container so that it may be located.

Figure 1: Schematic Layout of the Empty Container Depot (not drawn to scale).

Contractual arrangements of the empty container depot establish that containers are retrieved in a FIFO sequence. This is imposed as the depot offers a free storage time for the empty containers, so the shipping line demands that containers that arrive first be dispatched first to avoid any storage fee that may incur if containers exceed the free storage time.

The Solution

Problem Description and Simulation Model

The decision variables we included in the model were the operations concerning remarshalling, stacking and retrieving of empty containers. We also modeled the layout of the yard and the transport lanes. And, we portrayed container deliveries and pick-ups stochastically along with random variables to represent the condition of a given container (and, therefore, its need for maintenance or repair). Because of the complexity of this stochastic system, we propose the use of a discrete-event simulation model with a related database to evaluate different policies and configurations. The performance measures to be considered are expected truck turnaround times (cycle times), yard crane utilization, and container dwell times (time in the system). An issue taken into account in the model is that containers must be stacked in assigned blocks exclusive to each customer.
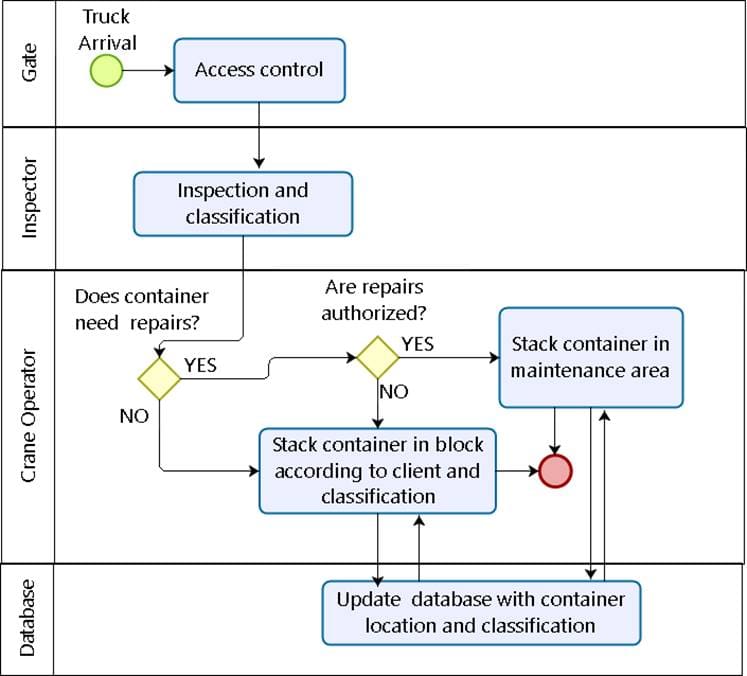
To represent the operations at the depot, data was collected from three sources. First, we considered a study already performed by the ECD to gather arrival process data. Second, we collected our own field data on different process times, and, third, the depot provided access to data in their ERP database. We made detailed stochastic models of the following functions: gate-in, gate-out, massive movements (when a customer requests a large number of containers to be shipped empty for repositioning), and remarshalling of containers (reorganization of a block to facilitate future container retrievals). To do this, the equipment was modeled in terms of how long each movement took. For example, trucks move at a certain rate and the time involved depends on the distance moved at the depot. Also, the cranes move at a certain rate around the yard and loading and unloading containers depend on the height of the containers in the tier. Furthermore, the operation times of inspection, maintenance and so on are stochastic. In summary, we made the model as detailed as pragmatically possible and fitted probability distributions such as triangular or exponential to the operations based on the actual data from the three sources above (more details on this are in Table 1). The Gate-in process described in Figure 2 is an example of the logic as it was modeled in the simulation.

Figure 2: Gate-in operation that was represented in the simulation model.

In the simulation model, built in Simio, trucks and containers are represented as entities and they relate to each other through combiners and separators (for load and unload processes). Servers are used for gate- in, gate-out and inspection operations. The depot layout is represented by pathsnodes and detached queues and these elements are organized in a table. Cranes are represented as vehicles. The logic of depot operations is built within process modules, these define the sequence or route of trucks and all crane requests for activities such as block remarshalling or maintenance.

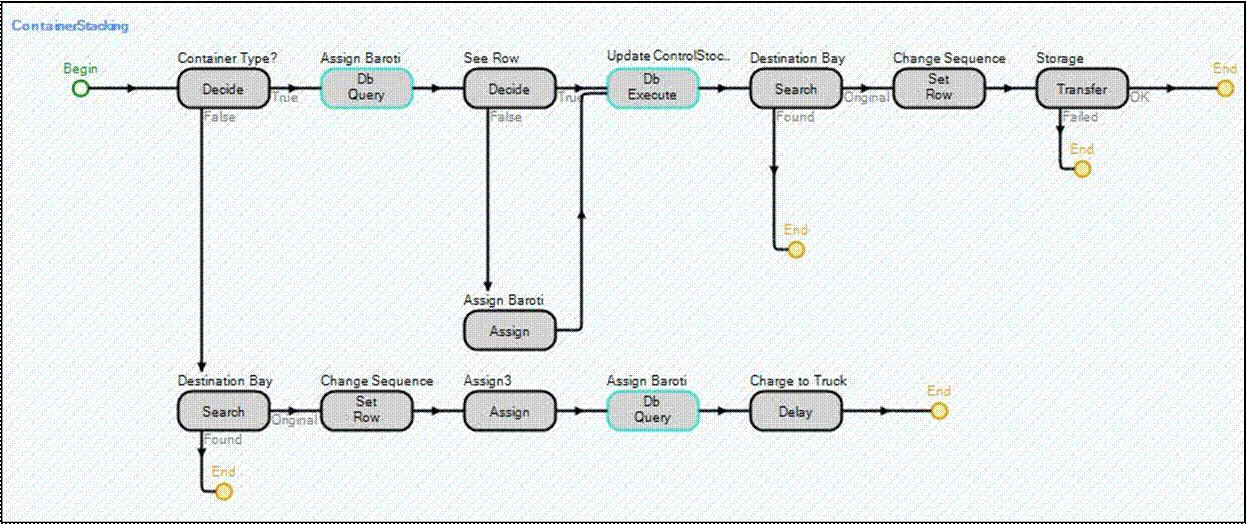
The simulation is initialized with information regarding containers in the depot; this data is obtained from the real system at a particular date. The model interacts with an external database (SQL Server) that performs all the data processing. During the simulation run, queries and updates of this database are performed in process modules. There are three external databases that may be used during the simulation run. The principal of these databases registers the current position, and all other attributes, of all containers stored in the depot. Several queries and procedures are implemented for this database. These procedures calculate the time it takes a crane to retrieve a container from a block or to remarshal a block; it also determines a position for all incoming containers according to their classification, and establishes the final position of containers that have been moved or remarshalled. The other two databases correspondingly contain registries of the history of all container or truck movements, and they are particularly useful for validation purposes as they mimic the databases used by the real system. Specific details of the simulation model for the container stacking operation are in Figure 3. As observed in the figure, the process begins when we need to assign a stacking location to a container in the yard. The process includes the corresponding update in the database.

Figure 3: Container stacking operation represented in the simulation model.

Figure 4 presents the container retrieval operation as represented in the model. This occurs when a container has to be retrieved from a block to be dispatched to a truck or to be relocated in the yard.

Figure 4: Container retrieval operation represented in the simulation model.

Container reshuffling operations, or housekeeping, are shown in Figure 5. As represented in the simulation model, this operation consists of relocating containers from their current positions to facilitate future efficient retrieval operations and reduce service times for the external trucks.

Figure 5: Container reshuffle operation represented in the simulation model.

In the simulation scenario we consider operating hours from 8:00 AM to 6:30 PM. For high demand days, i.e. when massive shipping gate-out runs are programmed, the work shift is extended to operate during the night (24 hour operations). During lunch (1:30 – 3:30 PM), service capacity is reduced by half. The four top-lifter cranes operate on a FIFO request order. Housekeeping operations (where containers are remarshalled to improve retrieval) are done during idle times (though we also consider explicit remarshalling efforts as described later in this paper). The service of trucks arriving to the depot is FIFO with the exception of massive movements, which are generally associated with repositioning operations of a shipping line. Each block of the yard is assigned to a single customer and containers are segregated according to the condition class (two classes can be mixed in the same block if there is high demand at the yard). Damaged containers that have been authorized for maintenance or repair service are moved at 8:00 AM to the maintenance area, and at 7:00 PM those containers that were repaired are taken back to the yard and stacked at appropriate locations.

Considering the historical database provided by the empty container depot under study, for each input variable we performed a goodness-of-fit test to determine an appropriate probability distribution to be used in the simulation experiments. Results are presented in Table 1. Notice that for the gate-out process we consider both the entry and exit service times of the trucks, while in the case of the gate-in process we only consider the time required at the gate.

Table 1: Input variables and their probability distributions (all units in seconds).

Input Variable Probability Distribution
Container´s Inspection Time 20’ ∼ LogLogistic (4.46823, 178.5) + 59.097
Container´s Inspection Time 40’ ∼ LogNormal (166.07, 121.81) + 70
Gate-in Time of Trucks ∼ Weibull (1.4892, 155.85) + 90.386
Gate-out Time of Trucks -Entry ∼ Triangular (20, 30, 35)
Gate-out Time of Trucks -Exit ∼ Weibull (1.497, 119.83) + 109.34

An experimental design was specified to provide analysis of various policies in the depot and their effects on the outcome variables of interest. The design included the following input parameters:

  • Retrieval policy – we considered four versions: Easiest to retrieve (ET), and three variants of FIFO. The FIFO variants are: FIFO-strict (SF); FIFO-relaxed with a 5 day window (RF5) and FIFO- relaxed with a 10 day window (RF10).
  • Remarshalling policy – we considered four versions: remarshalling continuously, all day (DR), remarshalling once a day (1R), remarshalling twice a day for shorter durations (2R) and remarshalling twice a day for longer durations (3R). One or two cranes were assigned to perform the remarshalling operations.

The above design gives a full factorial of 16 combinations which were tested in the simulation model. The number of replications varied according to the complexity of the scenario tested but we maintained the same precision of mean estimate throughout. The confidence intervals are 95% and most scenarios required around 100 replications, while the low variability scenarios (i.e., for the “easiest to pick” retrieval policy) required only 20 replications. Each replication consists of 365 days and considers 180 days of warm-up.


The Business Impact

Results and Discussion

We found that the retrieval policy, the remarshalling policy and the interaction between the two are all highly statistically significant through an ANOVA analysis. This is true for all outcome variables considered. These results are not surprising. First, the outcome variables are somewhat correlated (for example, a long queue will result in a longer time in system). Second, the impacts of which containers to retrieve and how much remarshalling is done are obviously important.

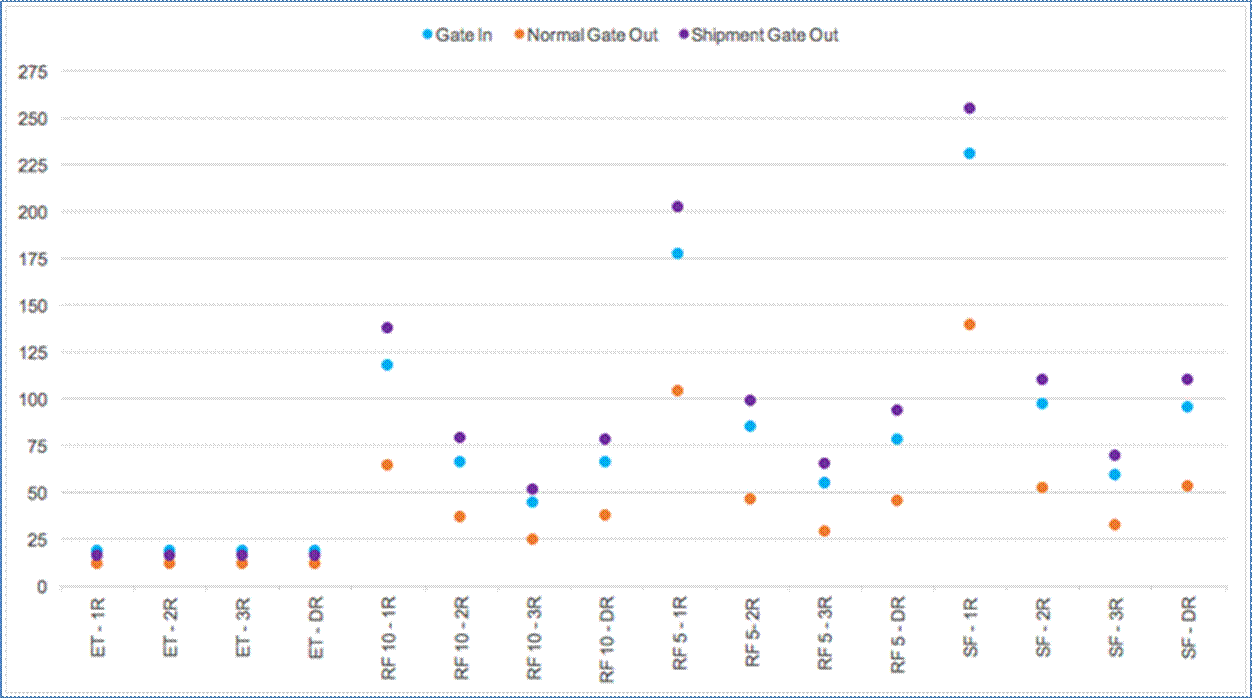
What is more interesting are some of the detailed effects which are shown in the figures below. Figure 6 shows the effects of the various policy changes on the response variable, mean truck turnaround time (time in the system) for the operations of gate-in and gate-out. For each retrieval policy –from left to right these are easiest to retrieve (ET), relaxed FIFO within 5 (RF5) or 10 (RF105) days and strict FIFO (SF)– and for each remarshalling policy –once a day (1R), twice a day shorter (2R), twice a day longer (3R) and all day (DR)– are on the axis while the truck turnaround time in minutes is on the axis. The figure presents the resulting time in the system for three conditions: Gate-in, Normal Gate-out and Shipment Gate- out. Gate-in corresponds to the time in the system for the trucks that are dropping off a container at the depot. It considers the time that starts when the truck enters the queue for inspection of the container and ends when that truck exits the depot. The Normal Gate Out measures the time in the system for those trucks that arrive at the depot to pick up a particular container that will be delivered to a shipper. It considers the time beginning when the truck enters the queue at the gate until the time the truck exits the depot. Shipment Gate-out corresponds to the time in the system of trucks that are performing a batch transport service of containers to the port (massive movements). Shipment Gate-out and Normal Gate-out differ in that trucks have different arrival patterns and the depot organizes the operations in different queues and servers.

As observed in Figure 6, if the contractual arrangements with the shipping companies are ignored (ET case) the depot can operate most efficiently. This is ideal from the depot’s perspective but ignores the costs imposed on the shipping companies by storage fees. At the other end of the spectrum, the strict FIFO which is most favorable to the shipping companies results in longer processing times, though remarshalling helps mitigate much of this. Relaxing the FIFO rule has improvements especially in the case of minimum remarshalling (1R). Turning to remarshalling, for the speediest service times it is best to remarshal twice a day for longer durations. In fact for the option of remarshalling all day (DR), even during peak times one crane (crane 4) is dedicated to remarshalling so is unavailable to service pick-up or delivery trucks. This causes the average times (Gate-in and both types of Gate-outs) to increase.

Figure 7 has the same axis but the axis portrays the average utilization of four cranes and the utilization of the main crane used in remarshalling activities. Strict FIFO requires more active cranes while retrieving the easiest to get container uses the cranes for the least proportion of time. What is interesting is that the remarshalling policies impact crane utilization for the three versions of FIFO. More remarshalling results in lower crane utilization except for crane 4 which is dedicated to all day remarshalling (notice the 100% utilization). This may seem counterintuitive but the extra time spent rearranging the containers more than compensates when it comes to retrieving specific containers.

Figure 6: Mean truck turnaround time (minutes) for the 16 policy combinations considered.

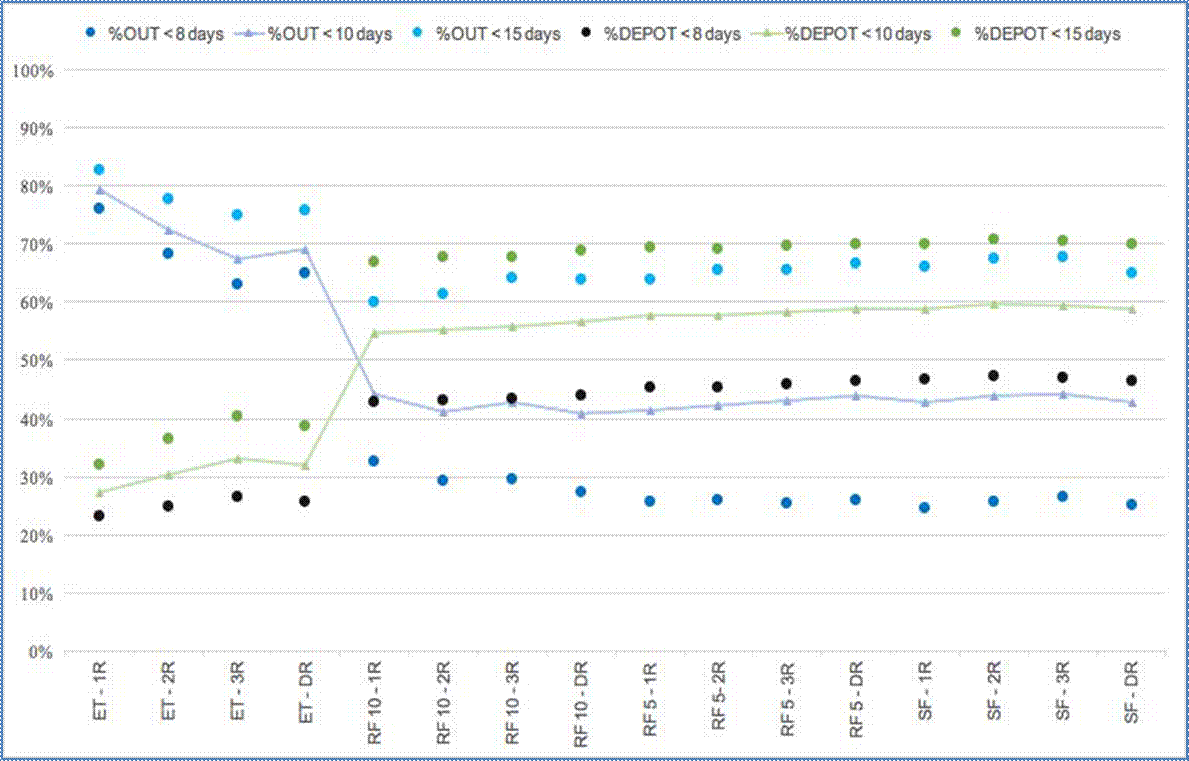
Finally, we will consider the number of days a container spends at the depot. Figure 8 shows this, again with the same axis of the different policy combinations. The axis shows the percentage of two things. With the first three series, it shows the dwell time of containers that have left the depot grouped in three statistics (%OUT): those that spend less than 8, 10 and 12 days at the depot. With the second three series, it shows the composition over time (in terms of how long have containers been at the depot) of the containers that remain at the depot (%DEPOT). This comparison allows us to see the effect of different retrieval policies. Containers, for the most part, spend less time in the depot if they are retrieved by the easiest policy (ET). However, under this policy some containers spend a very long time at the depot. This is because containers that are easily accessible are retrieved quickly after arriving at the depot while those that are less accessible are only retrieved when needed (that is, when fewer containers are in the depot). In the FIFO retrieval rules, there is a better container turnover ratio as less than 30% of the containers at the depot at any given time have been there more than 15 days (compared to the approximately 60% in the ET case). Remarshalling does not have a striking effect on this output variable.

Figure 7: Average crane utilization (%) (crane 4 does remarshalling tasks).
Figure 8: Percentage of containers that spend less than a certain number of days at the depot under the 16 policy combinations.

Conculsions and Recommendations for Further Research

Results presented in previous section enables the evaluation of different retrieval and remarshalling policies under different scenarios. The figures are representative of those we produced for the consideration of the depot management. While some results are expected and intuitive, others are not. And, even for expected results, the simulation model quantifies the effects in a clear manner. Based on the results found we observe that the strict FIFO results in higher operational times for the depot and also for the users (truck companies) that pickup and drop-off empty containers. The depot may evaluate the commercial arrangement with the shipping lines and re-negotiate the contracts so that a relaxed FIFO policy could be employed to reduce operational times. This can be also supported by the results in which containers with lower dwell times resulted from the ET policy. In fact, the ET policy has many appealing aspects to both the ECD and to its customers. This policy is radically different from the current policy of strict FIFO, however, using the analysis from the simulation model, it is persuasive that the ET model should at least be considered.

Going forward, this simulation model will serve as the virtual test bed to consider more innovative retrieval policies, more complex remarshalling policies and the layout configuration of the depot itself. As further research we propose to extend the simulation model to consider different layout designs of the empty container depot to evaluate different configurations under different retrieval and remarshalling policies. The ECD will be able to evaluate other layout configurations that may increase the stacking capacity of the empty container depot. In addition, the ECD can use the quantitative results to re-negotiate the current conditions of the contracts with the shipping lines. We also recommend to the possible implementation of a truck notification system to gain more information on the truck arrivals patterns and sequence. It is also of note that this paper presents a specific case study but the components of the simulation model and the approach to develop, validate and use the simulation are general. It is likely that thousands of such ECD’s around the globe can benefit from this approach.

ACKNOWLEDGEMENTS

This project was supported in part by CONICYT Chile, project MEC 80140051, and by the Fulbright Commission.