Skip to content
simio-background-png

Evaluating an Emergency Department Care Redesign: A Simulation Approach

The Challenge

by Breanna Swan, Osman Ozaltin, Sonja Hilburn, Elizabeth Gignac, George McCammon Jr.

As presented at the 2019 Winter Simulation Conference

Complex interactions between workload variability, uncertain and increasing arrival rates, and resource constraints make it difficult to improve flow through emergency departments (EDs). This complexity causes crowded EDs, long patient lengths of stay, and burnout among care providers. One way to improve efficiency while maintaining high quality care is to switch from a siloed unit-based department to a team-based design or pod system. This paper seeks to compare a pod system against the unit-based design at Southeastern Health’s ED using a discrete event simulation. Robustness of the model under a selection of staffing designs will be tested with increased arrival rates and varying mixes of severity for incoming patients. Ultimately, it is shown the pod system maintains quality of care metrics while increasing resource utilization, establishing proof of concept that an optimized pod system can improve flow in the ED.

Introduction

Emergency Department (ED) crowding due to long patient lengths of stay increases the chances of patient harm and reduces patient satisfaction. Crowded EDs also reduce job satisfaction, reduce productivity, and causes burnout (Wiler et al. 2011). Complex interactions between workload variability, uncertain and increasing arrival rates, and resource constraints make it difficult to improve flow and reduce crowding. The complexity of EDs and the introduction of big data from electronic health records suggest an evidence-based decision tool is vital in supporting ED leadership and policies.

Forecasts of increased healthcare use and decreased resources compound the life-threatening issue of crowded EDs; the American Hospital Association estimates 33% of rural and 69% of urban hospital EDs are functioning at overcapacity yet there continues to be a significant shortfall of registered nurses. Teaching hospitals face additional considerations; residents need quality instruction time from preceptors and hands-on learning experience from patient caseloads which both impact physician efficiency and patient’s length of stay. One proposed method for overcoming these barriers while improving patient care is to redesign siloed ED units into smaller yet more integrated team-based pods which have improved scheduling and staffing flexibility with the ability to balance patient workload amongst teams of care providers.

Southeastern Health’s ED, which sees over 170 patients each day, aims to improve patient outcomes and staff experience by reducing patient length of stay by transitioning to a pod system. The purpose of this work is to evaluate and compare performance of a pod design to the current unit design using a discrete event simulation built. Performance and robustness across multiple configurations of staffing models (i.e. number of nurses per shift) and department designs (unit or pod) will be evaluated for expected demand, increased arrival rates, and varying patient severity mix. The key performance metrics are length of stay (LOS) measured by time from registration to discharge, resource utilization, and ED volume (i.e. the number of patients in the ED at a given moment in time).

Relevant Literature

Discrete event simulation (DES) is useful for experimenting with new policies and in preparing for future events such as increased arrival rates or changing staff levels. It has been applied to identify the best patient care pathways, efficiently allocate resources, and determine staffing designs (Oh et al. 2016; Augusto et al. 2018). In particular, Oh et al. used simulation to reduce patient LOS by evaluating and comparing system improvements; they ultimately found reducing adult patient CT scan oral contrast drink time, increased self-dictation use in radiology, and reducing sample re-collection rate had the most influence on reducing LOS.

Transitioning to a pod system requires the redesign of pod scheduling, staff assignments, and patient routing rules. Mixed integer optimization (Sir et al. 2017), simulation models, and queuing theory are techniques used to determine new shift templates for care providers and pod scheduling. Designs vary from physician-led teams assigned to specific beds with each pod randomly assigned patients (Patel and Vinson 2005) to more dedicated pods to suit patient population needs like pediatric and low-acuity specific pods (Oh et al. 2016; Dinh et al. 2015). Routing of patients to pods is critical to flow; Agor et al. developed a workload score to reduce the time the ED spent at maximum utilization. The score considered pod and ED attributes like number of behavioral health patients and queue length (Agor et al. 2016). Finally, new roles such as a navigator overseeing patient flow (Dinh et al. 2015) or a dedicated nurse technician transporting patients to beds may be needed for a successful transition from unit-based designs to a pod system.

Team based care has been studied observationally and in DES models and is shown to reduce time to patient’s first visit with a physician, reduced left without being seen cases, improved patient satisfaction, and reduced LOS while maintaining clinical quality of care (Patel and Vinson 2005; Oh et al. 2016; Dinh et al. 2015). Beyond patient experience, team based care also has been shown to improve staff experience. Teaming residents with a single physician, all seeing common patients, was associated with improved perceptions of quality of teaching (Nable et al. 2014).

The practical successes of a pod-based design in the ED paired with the flexibility of discrete-event simulation modeling suggest that this work can improve ED flow and inform staffing configurations and unit scheduling at Southeastern Health.

The Solution

Model Building

Performance of the current unit design at Southeastern Health as compared to the proposed pod-based system was evaluated using a discrete event simulation built in SimioTM University Enterprise Version 10.

Data and Simulation Inputs

Inputs and validation for this model were inferred from over 88,000 unique visits, each with over 150 variables including timestamps, visit attributes, and patient outcomes. Patient-level visit data was available from November 2017 to April 2019 and was matched to the ED subprocesses of laboratory tests, radiology, transporters, and psychiatric and community care consultations. Physician and nurse schedules along with daily bed assignments for 2018 and 2019 defined the current staffing levels.

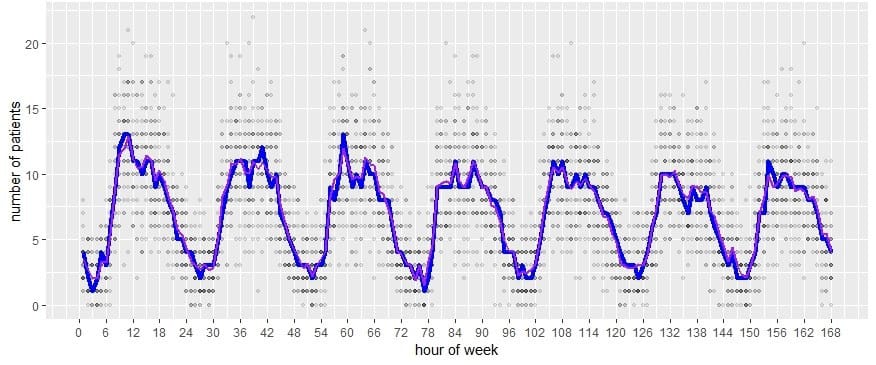
Training and testing sets of data were partitioned for inputs and validation. Data analysis was performed in R (Version 3) and JMP Pro 14. Laboratory tests and radiology imaging were grouped into 7 and 8 primary categories, respectively. Differences between timestamps were used as processing times for registration, triage, transportation to and from radiology, specimen collection for labs, labs and imaging from order time to results, disposition decision, and time from disposition decision to discharge or admission to hospital. Some processes such as individual nurse and physician visits were determined from system expert interviews and compared to literature. The hourly arrival rate was uniquely defined from 12:01a Monday to 12a Sunday (Figure 1). Additional proportions extracted from data include arrival mode (ambulance versus front door), acuity, unit assignment, final disposition, and binary variables of behavioral health patient, combination of labs and imaging per visit, and community care consultation. The model was calibrated until the observed outputs (LOS, bed utilization) were validated by adjusting unknown data fields like number of nurse visits per patient and amount of time the nurse or physician visits a bed, dependent on patient acuity level.

Figure 1. Time-varying hourly arrival rate into Southeastern Health’s ED from 12:00a Monday to 11:59p Sunday using data from November 2017 – February 2019. Each dot represents an observed number of patient arrivals that hour of the week. The median (blue line) and average (purple line) number of arrivals per hour of the week is summarized.

Patient Flow

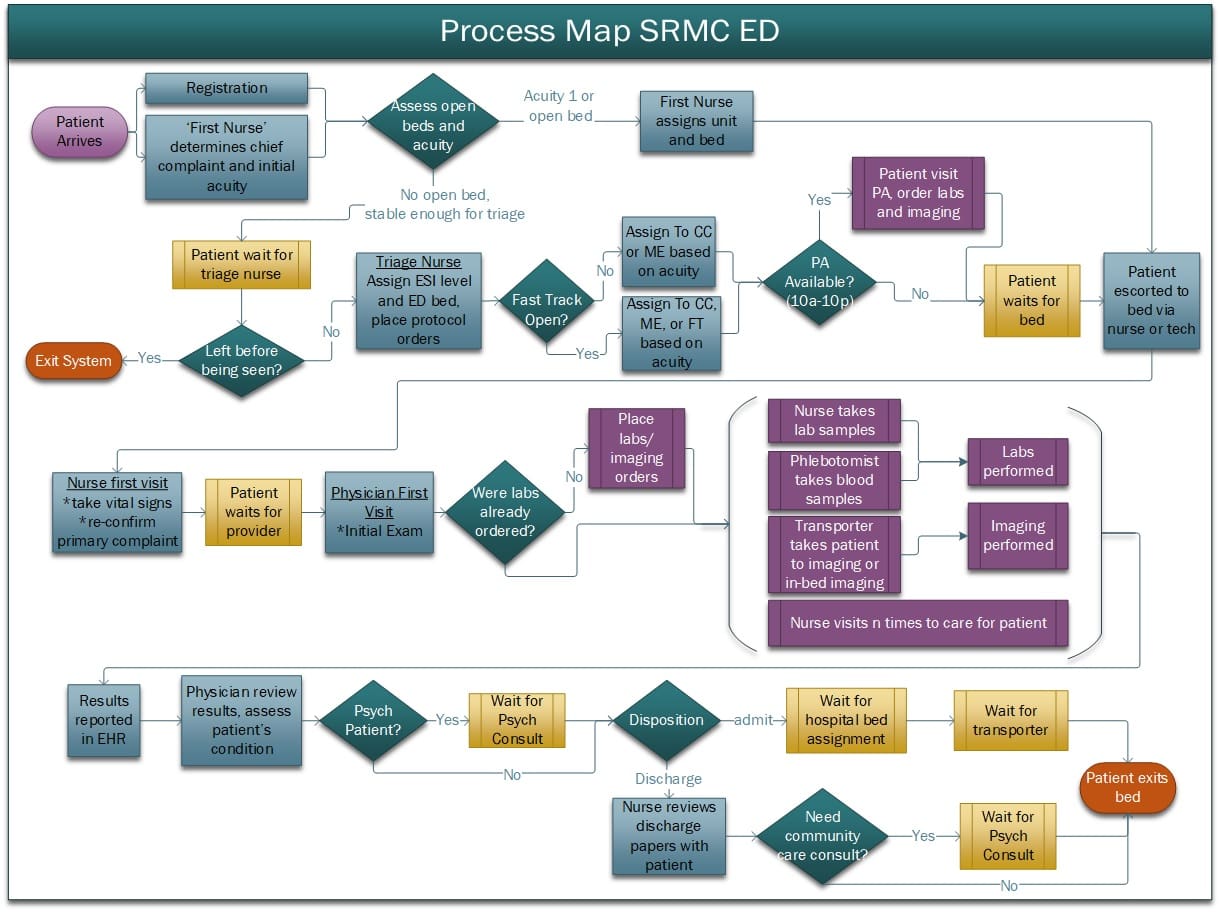
A patient arrives to the ED either through the front door or by ambulance and will immediately be registered at the front desk. An emergency severity index (ESI) level is assigned based on chief complaint and the estimated number and mixture of resources the patient will require for care. This level ranges from 1 (most severe) to 5 (least severe). Patients presenting high-severity symptoms (ESI 1) will immediately be placed in a bed in the critical care unit and all others are sent to triage to receive a more thorough initial exam and unit assignment. In the current unit-design, patients are assigned to one of three units during triage: Critical Care, Minor Emergencies, and Fast Track. In the pod system, patients are assigned to one of six teams: Orange, Purple, Yellow, Blue, Green, or Grey. After triage, patients wait for an available bed.

At the bed, patients receive care through a sequence of care tasks including nurse and physician visits, specimen collections for labs, transportation for imaging procedures, psychiatry consultations, boarding (admitted patients), and community care consultations. It is assumed patients either get admitted into the hospital or discharged and exit the facility. The care process and subsequent patient LOS ends after the patient leaves the ED bed. The amount of time a physician or nurse spends with the patient throughout their stay depends on ESI level and unit.

Figure 2 displays a more detailed path of care for patients and the logic for steps (i.e. care at the bed) is described in section 2.4.

Resources

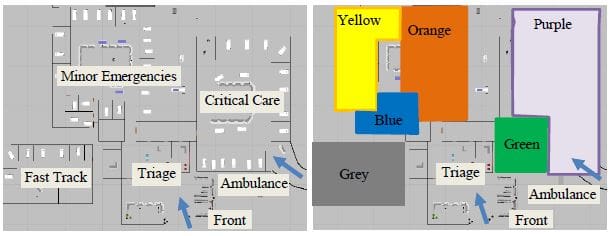
Figure 3 displays two designs of Southeastern Health’s ED department; the left is the current unit-based design and the right is the proposed team-based pod system. In both designs patients enter from the front door or via an ambulance, register, go through triage, and wait for an open bed in the waiting room (currently labeled as ‘Triage’). A nursing technician transfers patients from the waiting room to triage where patients see a triage nurse and, if during their 12-hour shift, a physician’s assistant (PA). After triage, patients wait for an open bed.

Figure 2. ED Process Flow Chart.

In the unit-based ED design (left Figure 3), Fast Track (FT) has 6 beds and is open from 10a – 10p but will stop accepting new patients at 9p. Minor Emergencies (ME) has 26 beds and Critical Care (CC) has 18 beds, both are open at all times. One midlevel provider covers all six fast track beds and works during the FT open hours of 10a – 10p. One physician covers all the ME beds while another physician covers all CC beds giving 48 hours of physician coverage per day. From 11a-11p, it is assumed there are 6 ME nurses and 5 CC nurses and from 11p-11a there are 5 ME and 4 CC nurses. In reality, the number of nurses working may vary due to staff availability.

In the proposed pod-based ED design (Figure 3, right), there are six groups of beds, or pods, with varying schedules and each staffed with teams of providers, nurses, and PAs. A physician and three nurses are assigned to the Orange pod. A physician and four nurses are assigned to the Purple pod. Both Orange and Purple pods remain open at all times. One PA and one nurse are assigned to the Blue pod which is open 11a-11p. One PA and two nurses are assigned to the Yellow pod which is open 9a – 9p. The Green pod functions as the new Fast Track and is staffed by one midlevel provider (PA or Nurse Practitioner) and is open 10a-10p. The Gray pod is open at all times and is staffed by one midlevel provider.

Globally shared resources include four 12-hour-shift phlebotomists starting sequentially 4a – 7a and one night-shift phlebotomist working 7p – 7a. There are three transporters 7a – 7p and one 7p – 7a. Finally, to perform behavioral health consultations, a psychiatric physician rounds once a day between 8a and 10a.

Figure 3. Facility Layout: Unit-Based Configuration (left) and Pod-Based Configuration (right).

Programming Logic

Patients arrive via a time-varying arrival rate defined for each of 168 hours in a week to account for hourly and daily arrival fluctuations. Patient and visit attributes are assigned via row reference to a data table. Patient routing is defined through a global network of paths with routes to triage or to beds requiring a nurse or nursing tech escort.

Triage is a two-step task sequence. Patients first receive a unit or pod assignment from the triage nurse then visit the triage PA. In the unit-based system, behavioral health patients are assigned to ME and all others are assigned to CC, ME, or FT based on acuity and bed availability. After processing, the triage nursing technician escorts patients to the waiting room to wait for an open bed in their assigned unit. Patients are first assigned to a unit based on historical data trends then may switch between CC and ME based on the changing bed availability during their wait after triage.

In the team-based pod designs, the three units are redefined to 6 pods and assignments are based on balancing arrivals between available pods. Patients get assigned to the first available bed after being triaged subject to the following constraints. Behavioral health patients go to the Gray pod if beds are available, otherwise are sent to the behavioral health rooms in the Orange or Purple pods. Pods Yellow and Blue are led by PAs, thus, do not receive high severity patients. High severity patients (ESI 1 or 2) can only receive care in the Purple or Orange pods which are both led by ED physicians. The Green pod is dedicated to fast track patients, thus, patients with ESI levels 4 and 5 get assigned to Green if beds are available. Yellow, Blue, and Green pods accept patients up to 45 minutes before they close. If all beds are full, patients sit in the waiting room after triage and wait in a pooled first in first out queue for the first available bed (adhering to the acuity constraints described above).

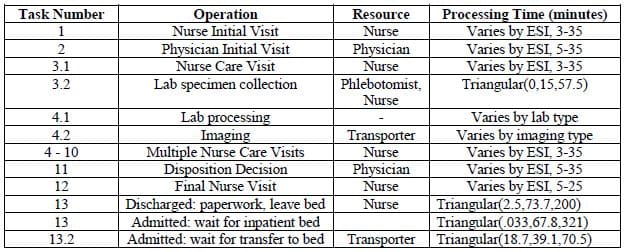
Bed processing is defined using Task Sequence data tables. Tables are referenced by patient acuity and by the operation currently being performed. The overall task sequence is the same for each patient (see Table 1) but conditions necessary for performing each task and resource requirements are unique per bed and per patient. To mimic reality, a nurse will cover the same 3-5 beds and a physician the same 10+ beds throughout their shift, defined by row-referencing in the model. Finally, Table 1 shows sequential tasks by changing integer numbers whereas tasks in parallel are denoted by changing decimal places. Individual nurse and physician visits, imaging procedures, specimen collections for labs, and transportations to/from imaging are sequential whereas lab processing can occur in parallel to these processes.

End of care is defined by a disposition decision from the physician. If the patient is admitted, they will wait for an in-hospital bed assignment and transportation. If discharged, the patient is ‘checked out’ by the nurse and may receive community care consultations. All behavioral health patients receive a psychiatrist consultation prior to the final disposition being assigned; admitted patients wait for a bed, discharged to a community facility patients must wait for an available location, waiting on average three more days in the ED. Both admitted and discharged patients stop at the ‘exit registration’ desk and exit the system. When a unit or pod closes (i.e. FT, Yellow, Blue, and Green), beds ‘finish work already started’ and no longer accept new patients.

Table 1: Task Sequence.

The Business Impact

Results

The simulation model runs for 4 weeks with a 2-week ramp-up period. Each run was replicated 10 times to ensure the validation parameters had the desired width around the true parameter.

Validation

Proportions of types of patients (acuity level, unit-assignment) and total expected patients arriving into the system were extracted from testing data and compared to simulation outputs for validation assuming the unit-based ED design. The model is calibrated by adjusting unknown data points which include the number of visits from a nurse and the amount of time a nurse or physician spends with the patient each visit, adjusted based on acuity level until the expected outputs related to LOS and ED volume are met.

Experiments

Two ED configurations are considered: 1) Unit-based [current] system and 2) pod-based design. Staffing and pod schedules are varied within each configuration and performance is compared for the expected demand, increased arrival rate, and increased number of behavioral health patients. Table 2 lists each ED configuration and staffing (for units) or scheduling (for pods) model. To note, when triaging patients for the pod system, these experiments assume the patient is assigned to the first available bed in any pod the patient is eligible to go to (the Programming Logic section describes eligibility rules based on ESI).

Table 2: ED Configuration and Staffing Experiments.

Performance of each configuration in Table 2 is evaluated in three scenarios: expected demand, increased arrival rate, and increased proportion of behavioral health patients. The first scenario is the current demand environment of Southeastern Health’s ED. A 10% increase in arrival rate is tested to evaluate each configuration under potential future demand. Finally, a 10% increase in the proportion of behavioral health patients (assuming standard arrival rate) is tested to simulate the environment after disasters such as Hurricane Florence. Each demand scenario tests the robustness of the staffing and unit configurations.

Performance

The three key performance metrics evaluated here are patient LOS, bed utilization, and ED volume. The LOS is evaluated across each patient severity level (ESI 1-5). Bed utilization is individually considered for each unit or pod. ED volume averages the number of patients in the entire ED at a given moment in time.

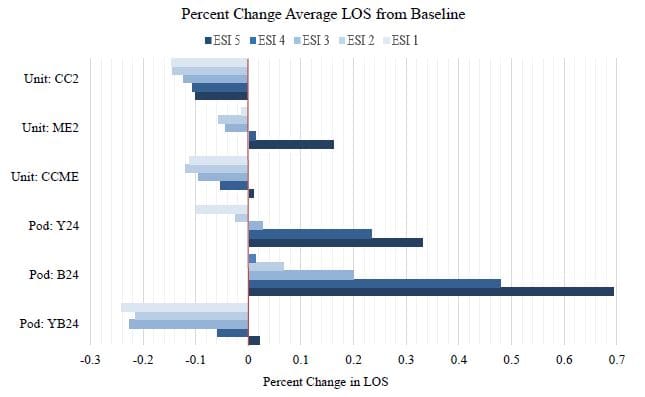
Under expected demand, configurations are evaluated on the average LOS for each patient severity group (i.e. ESI level). Figure 4 shows the percent change in average LOS between the current system (‘Unit’) and the listed configuration. The best models have the most negative changes. Using the current unit design, the addition of a CC nurse reduces LOS by over 10% for all patient acuity levels while ‘Pod:YB24’ performs the best in terms of LOS for patients with ESI levels 1-4.

Figure 4. Performance of pod and unit configurations under expected demand.

It can also be inferred from Figure 4 that having only Blue or only Yellow pods open 24/7 (i.e. Yellow or Blue are open only 12 hours a day, respectively) is not enough capacity for this ED’s demand. This is seen in the high percent increase in average LOS, more severly impacting the lower acuity patients.

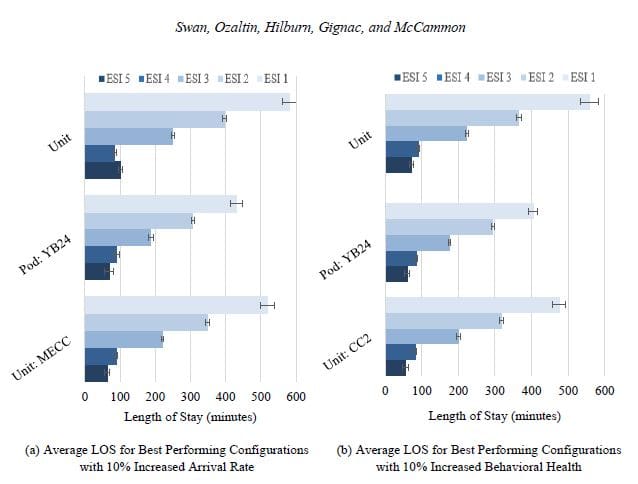
Figure 5. Top Performing Unit and Pod Configurations under the unexpected conditions of (a) increased arrival rate and (b) increased behavioral health patients. Error bars indicating the 95% confidence interval across replications.

Next, we consider performance under unexpected demand (Figure 5(a) and 5(b)). First consider a 10% increase in arrival rate (Figure 5(a)). In the unit design, the top-performing configuration was an additional nurse in CC and ME. For the pod design, the top-performing configuration was keeping Yellow and Blue pods open 24 hours. Under the increased arrival rate, the current system (Unit) has an average LOS of 264 minutes across all patients. The top-performing configurations reduced the average LOS; Unit:CCME had an average LOS of 235 minutes while Pod:YB24 had an average LOS of 206 minutes. Looking at each individual ESI level, the unit-based system tends to have a shorter LOS for the less severe patients in ESI 5 with the pod system having shorter LOS for the more severe patients in ESI 1, 2, and 3. The pod configuration with yellow and blue pods open 24/7 overall outperformed the unit based system under increased arrivals. The other unexpected scenario explored is a 10% increase in behavioral health patients (Figure 5(b)). Here, the top performing configurations were Pod:YB24 and CC2 with the pod configuration with yellow and blue pods open 24/7 overall outperforming the other configurations. Of special interest here is ESI 2 which is the severity level behavioral health patients are classified as. Again, PodYB24 slightly outperforms CC2 in this acuity level. Under both unexpected conditions, Unit:CC2 and Pod:YB24 reduced average LOS across acuity levels as compared to the current staffing configuration. The greatest change between the pod and unit designs can be seen for the most severe patients; the pod system and its goal of balancing workload results in a lower average LOS for ESI 1 patients.

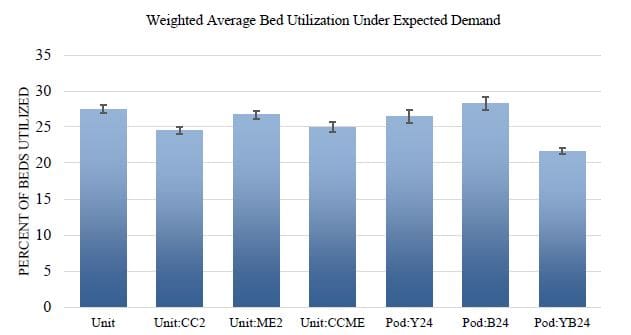
To assess efficient use of resources, a weighted average utilization was calculated per pod or per unit to account for varying number of beds in each unit. As described above, in the pod configurations, the number of beds vary from 10 (Purple and Orange) to 4 (Blue) while in the unit configuration ME has 26 and FT has 6. For each configuration in Figure 6, the bar displays the sum of each pod or unit utilization multiplied by the number of beds in that pod or unit.

Figure 6. Average bed utilization for each unit or pod configuration, weighted by the number of beds in each pod or unit, with 95% error bars.

The pod configuration with Blue open 24 hours a day has the highest weighted utilization while the pod configuration with Yellow and Blue open 24 hours a day has the lowest weighted utilization. Additionally, Figure 6 shows the utilization does not drastically change between unit configurations under varying staffing levels. Of most interest here is understanding how bed utilization relates to patient ED LOS. Comparing the Pod:YB24 configuration across Figures 4-6, a lower weighted bed utilization relates to a lower LOS for ED patients.

The final metric considered for performance is a snapshot of the number of patients in the ED at a given moment in time. Across 10 replications, the average patient volume in the ED and its 95% confidence interval was calculated for each configuration and is summarized in Table 3.

Table 3: Average Volume of Patients in ED across 10 replications.

The confidence intervals give insight into the range of volumes that can occur in the ED over the four week simulation period. For example, Unit:CC2 has a slightly smaller confidence interval and slightly smaller standard deviation in the volume of patients as compared to the current unit configuration. Additionally, the pod design with both Yellow and Blue open 24 hours has the smallest confidence interval and standard deviation of all pod designs. It can be inferred that the smaller the confidence interval widths and standard deviations, the more that configuration encourages a consistent flow of patients through the department and avoids unnecessary wait times for patients. Overall, the unit configurations have lower patient volumes in the ED as compared to the pod configurations but, as displayed in previous figures, the pod system tends to outperform the unit configuration in patient LOS.

Unit and pod configurations are evaluated from different perspectives in Figures 4-6 and Table 3, only by evaluating each staffing design across all metrics can we understand how it will impact patients and staff in the ED.

Discussion and Conclusions

Workload variability, uncertain arrivals, and resource constraints lead to overcrowded EDs, patient dissatisfaction, and provider burnout. Here, improvements to patient flow through an ED were evaluated using a discrete-event simulation to compare a team-based pod system to the current system. Each system’s performance was measured using patient LOS, ED volume, and resource efficiency. The simulation application and projected results were demonstrated for Southeastern Health’s ED.

Under the current expected demand, the pod configuration with Yellow and Blue pods open 24 hours significantly reduced LOS for patients of severity levels ESI 1-4. This configuration also performs well in terms of volume of ED patients (Table 3) with Pod:YB24 having volumes on-par with that of the current unit design. Alternatively, this configuration had the lowest weighted average bed utilization suggesting there could be a schedule which more optimally utilizes beds to match expected demand.

The team-based pod design tends to be more robust than the unit design under varying demand environments. If arrivals to the ED increases by 10%, a pod design is estimated to have an average patient LOS one hour less than the current staffing design at Southeastern Health (Figure 5(a)). The pod system has the most impact on high severity patients, having a significantly lower average LOS than even the best performing unit configuration. Also considered was an increase in the proportion of behavioral health patients, a population which significantly impacts patient flow in the ED as they stay a minimum of 24 hours in the ED. The team-based pod design was more effective at absorbing this change in demand and maintaining a low average patient length of stay. Specifically, the pod design has a significantly lower average LOS for ESI 2 patients, the severity level assigned to behavioral health patients, compared to the unit configurations which has a cascading effect on lowering LOS for other severity levels.

This work is the first step towards streamlining the care redesign of Southeastern Health’s ED to a pod-based design. Tradeoffs between patient care performance metrics like LOS and ED volume and the financial metrics of scheduling pod open hours and staffing are of special interest. Work remains in analyzing performance of both unit and pod configurations using alternative metrics such as the number of ‘left without being seen’ patients, wait time for an ED bed, and nurse and provider utilization. Other experiments to be considered are alternative routing rules for pods and adding residents as a resource. Finally, the model can continue to improve through the addition of details such as identifying trauma patients and adding community care consultations. As the pod system develops at Southeastern Health, further experiments with pod assignment can be performed to improve workload balance and further diminish wait times. Additionally, exploration of pod scheduling and staffing will help inform ED operations at Southeastern Health.

As EDs across the nation are seeing increased arrival rates and potentially decreasing budgets and staff, there is a need to improve efficiency of care without increasing resource requirements. The simulation model developed here suggests that EDs can improve patient flow while more efficiently utilizing resources by switching to a team-based care design. Beyond performance metrics, team-based care models in the ED have been found to increase patient satisfaction, enhance the learning environment for medical residents, and decrease provider burnout. Further enhancement of this model and testing new experiments in staffing and patient routing will inform hospital policy makers and empower them to make evidence-based decisions; ultimately providing high quality and efficient patient care using staffing models robust enough to withstand an uncertain future.

Acknowledgements

The authors would like to give a special thank you to Katy Smith for being a constant Simio resource and irreplaceable problem solver. Additionally, this project could not have been possible without Donna Coleman, Kyle Collins, Jason Cox, and the entire ED team at Southeastern Health.

Author Biographies

BREANNA SWAN is a PhD student in the Edward P. Fitts Department of Industrial and Systems Engineering at North Carolina State University. She holds a MS in Mathematics from the University of Wisconsin – Milwaukee. Her research interests are in effectively using big data in real time through simulations, predictive analytics, and optimization models; specifically as it applies to healthcare. Her email address is [email protected].

OSMAN Y. ÖZALTIN is an assistant professor in the Edward P. Fitts Department of Industrial and Systems Engineering and a member of the Personalized Medicine Faculty Cluster at the North Carolina State University. He received his M.S. and Ph.D. degrees in industrial engineering from the University of Pittsburgh. His research interests span theoretical, computational, and applied aspects of mathematical programming, focusing on optimization problems arising in public health, personalized medicine, and healthcare delivery. His methods include integer programming, stochastic programming and bilevel programming. His email is [email protected].

SONJA HILBURN is the Director of Emergency Services at Southeastern Health. She received her BSN from University of North Carolina-Wilmington and her MSN from Western Governors University. Her research interests are in reducing length of stay and improving patient experience in the ED; her work was recognized in Atrium Health’s 2018 Touchstone Awards which are given to high-achieving projects demonstrating best practices in patient safety and clinical outcomes. Her email is [email protected].

ELIZABETH GIGNAC, DO, serves as the Associate Director and Program Director for the Emergency Medicine Residencey Program at Southeastern Health in Lumberton, NC. Dr. Gignac founded the state’s first Osteopathic emergency medicine residency program with Campbell University School of Osteopathic Medicine where she continues to serve as a faculty member. She attended medical school at Michigan State University College of Osteopathic Medicine and completed her EM residency at Metro Health in Grand Rapids, MI. Her email is [email protected].

GEORGE MCCAMMON JR., DO, serves as ED Medical Director, Assistant EMS Medical Director, Epic Physician Contact Expert, and Emergency Medicine Residency Associate Program Director at Southeastern Health in Lumberton, NC. He is also an Emergency Medicine faculty member at the Campbell University School of Osteopathic Medicine. His research interests include performing medicine in unexpected situations like Hurricanes Matthew and Florence. He attended medical school at WV School of Osteopathic Medicine and his EM residency at Metro Health Hospital in Grand Rapids, MI. His email is [email protected].

References

Agor, J., K. McKenzie, M. Mayorga, O. Ozaltin, R. Parikh, and J. Huddleston. 2018. “Simulating Triage of Patients into an Internal Medicine Department to Validate the Use of an Optimization-Based Workload Score”. In Proceedings of the Winter Simulation Conference, edited by W. K. V. Chan, A. D’Ambrogio, G. Zacharewicz, N. Mustafee, G. Wainer, and E. Page, 2881–2892.

Augusto, V., M. Murgier, and A. Viallon. 2018 . “Modelling And Simulation Framework For Intelligent Control Of Emergency Units In The Case Of Major Crisis.” In Proceedings of the 2018 Winter Simulation Conference, edited by M. Rabe, A.A. Juan, N. Mustafee, A. Skoogh, S. Jain, and B. Johansson, 2495-2506.

Dinh, M. M., T. C. Green, K. J. Bein, S. Lo, A. Jones, and T. Johnson. 2015. “Emergency Department Clinical Redesign, Team-Based Care and Improvements in Hospital Performance: A Time Series Analysis”. Emergency Medicine Australasia 27(4):317–22.

Nable, J., J. C. Greenwood, M. K. Abraham, M. C. Bond,a nd M. E. Winters. 2014. “Implementation of a Team-Based Physician Staffing Model at an Academic Emergency Department”. Western Journal of Emergency Medicine 15(6):682–686.

Oh, C., A. M. Novotny, P. L. Carter, R. K. Ready, D. D. Campbell, and M. C. Leckie. 2016. “Use of a Simulation-Based Decision Support Tool to Improve Emergency Department Throughput”. Operations Research for Health Care 9:29–39.

Patel, P. B. and D. R. Vinson. 2005. “Team Assignment System: Expediting Emergency Department Care.” Annals of Emergency Medicine 46(6):499–506.

Sir, M. Y., D. Nestler, T. Hellmich, D. Das, M. J. Laughlin Jr., M. C. Dohlman, and K. Pasupathy. 2017. “Optimization of Staffing Improves Patient Experience at Mayo Clinic.” Interface 47(5):369–471.

Wiler, J. L., R. T. Griffey, and T. Olsen. 2011. “Review of Modeling Approaches for Emergency Department Patient Flow and Crowding Research.” Academic Emergency Medicine 18(12):1371–79.