
by Javier Lara de Paz, Idalia Flores and Gabriel Policroniades (Universidad Nacional Autónoma de México)
As presented at the 2017 Winter Simulation Conference
Abstract
In a simple economic system each agent exchange its wealth in return of commodities emerging an unequal wealth and income distribution, which has been estimated through a Pareto Distribution and by Ginis Coefficient as well. This system has been long studied using different approaches, in this work a simple model of wealth distribution is enhanced through a dynamic system simulation approach implemented in SIMIO, considering the division proposed by Statistics and Information Bureau which divides population in ten equal sized monthly income class called deciles, which are represented by ten flow tanks in a fully connected network linked with FlowConnectors from the SIMIO's flow library. Agents wealth exchange is represented as a flow moving between tanks ruled by a specific exchanged function. Through simulation performances, using Mexicos information, a better insight and different scenarios are possible to obtain in order to support policy decision makers.
1 INTRODUCTION
Income inequality has become a key focus for economists and policymakers as wealth distribution in emerging markets and developing countries, as well as in Western economies, has become significantly unequal with a big gap between rich people and middle class. The fact that the rich get richer and poor stays poor is widely accepted even as a law, but why is this true?, and which are the reasons that in last decade this gap has become wider? (Reeve, 2015). To answer this questions it is needed to include many different factors and a more complex analysis should be considered. In this work we are presenting a simple simulation model of money exchange between a group of ten different agents (as a first approach), having each agent a different monthly income, as established in official economic studies for wealth distribution. This groups are named deciles as they represent population income distribution. Population is then divided in ten equal sized group and then ranked by monthly average income. For the present project Mexico is used as case of study as this country represents the world’s 15th economic based on its Gross Domestic Product (GDP), but also keeps the place one for the Organisation for Economic Co-operation and Development (OECD) countries in inequality income levels represented by the Gini coefficient (about 0.459). This disparities between domestic production and income levels, measured by the GDP, and poverty levels that this country has suggest a failure on wealth distribution policies. The main objective of this work is to simulate the dynamic of deciles economic system, in order to find scenarios for different parameters and getting a better insight of the problem assisting to public economic policies decision makers as well. The model is represented using an object oriented simulation software applying its corresponding flow library. The software SIMIO ver. 9 was used due to its intelligence object oriented framework (Pegden, 2008), which was useful to simulate a dynamic system approach. Although different wealth distribution simulation models are based on an Agent-Based-Model (ABM) approach carrying out simulations in ABM specialized programs as well (NetLogo, AnyLogic, Repast among others), we are using a different framework to construct the model.
When a wealth distribution research is carrying out, Pareto’s Law must be considered, developed by Italian economist Vilfredo Pareto (Gaffeo et al., 2008). His investigation was based among household wealth and personal incomes modeling with statistical methods using a power-law distribution which follows an universal pattern in the upper tail for the richest 1 - 5% of the population and for the rest of the 95% of the population, wealth distribution fits to a conspicuous log normal decreasing distribution or an exponential fitting is used as well. The mentioned Pareto distribution described by ‘Pareto-tails’, decays as a power law for large wealth

Where P>(𝑊) is the probability to find an agent with wealth greater than W, and μ is a certain exponent, of order 1 both for individual wealth or company sizes. Pareto estimated this parameter μ≈ 1.5 . Today the Pareto law is usually quoted in terms of the probability density function, P(W),

The other main parameter to measure wealth distribution and inequality income distribution is the Gini’s Coefficient. It is a statistical measurement of dispersion and variability of income or wealth distribution of a nation. Its values range from 0, which represents a perfect distribution, that means that all residents would have the same wealth or income. On the other side if its value is 100 % that means that just one person concentrates total wealth.
2 Wealth distribution simulation model.
The model is constructed using the flow library added in SIMIO ver. 9, and a system dynamics approach.
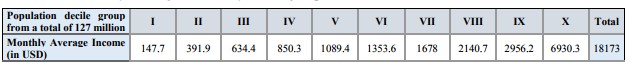
The information used is gathered form official databases. In table 2.1 is shown average monthly income in
$USD by each decile group for Mexico’s instance. Each decile (agent) described in table below corresponds
to a tank i with a monthly average income represented as tank volume, and will be connected to the other
agents by a flow connector forming a full connected network. Exchange between agent i with agent j is
considered under an uniform distribution suggesting that every agent has the same opportunity to have
affairs with the rest. This estimation will be validated by the simulation model.
Table 2.2.1. Monthly Average Income by decile group
2.1 Relevant aspects of the Simulation Model
To construct the model, flow library elements of SIMIO software were used. The rate of exchanged money which flows between tanks is calculated with a triangular distribution with parameters a=0 money, that means agent i doesn’t exchange money with agent j, b = to max amount of money agent is able to exchange. Parameter c corresponds to half the wealth agent i gets at moment t. This supposition is verified by simulation results, once the model is validated with Mexico´s wealth distribution parameters, Gini’s coefficient and Pareto’s wealth distribution, those exchange functions are being improved to obtain a better fit with real scenarios. To set initial wealth each decile monthly obtains, numeric properties were set and with simulation performance this quantities flows through flow connectors from tank i to tank j, as decided previously. Each simulation runs in an elapsed time of 30 days to obtain the final amount each decile gets at the end of this period.
3 Results and Conclusions
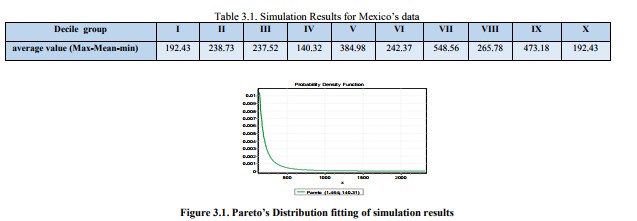
Using the information in table 2.1, 150 simulation were run along a period of 30 days each one, obtaining the following results showed in table 3.1 for An goodness of fit to Pareto’s distribution was done to validate our results (figures 3.1).
With the present model approach it is possible to improve exchange rules modifying the connector functions, remaining the network structure and implementing the source element to each tank, it permits to an increment on agents number, having by this a bigger population, showing the versatility and robustness of present approach and generating corresponding simulation scenarios allows policymakers to design more accurate economic programs in order to reduce wealth distribution inequality.